Over the decade from 2006-2015, spending for personal health care services increased by more than $2,400 per person, a 40 percent rise. The higher spending was observed across all sectors of the health care system. Personal health care spending excludes spending for investments in research ($47B in 2015), structures and equipment ($108B), government public health spending ($81B), and public ($43B) and private ($210B) administrative costs. With these components, total national health care spending totaled $3,206B in 2015, or $9,990 per person.
The 40 percent increase in per-capita personal health spending outpaced the 17 percent growth in median personal income over the same period, such that per-capita spending for personal health care services and products had climbed from 24 to 28 percent of median personal income by 2015. If one also accounted for investments in research, structures and equipment, government public health spending, and public and private administrative costs – another $1,522 per person in 2015 – the total per-person burden of all U.S. spending related to health care would total 33 percent of median personal income in 2015.
Growth in spending for hospital care and for physician and clinical services accounted for almost two-thirds of the total growth in per-capita personal health spending over the period. The contributions of these two sectors to higher spending are driven by their already sizeable share of spending at the beginning of the period as well as their high rates of spending growth. Hospital spending rose by more than $1,000 per person over the decade, while spending for physician and clinical services rose by more than $500.
Year-by-year trends reveal that per-capita spending for prescription drugs began to increase rapidly in 2014 after a period of relative stability. Per-person spending for other types of care – particularly hospital care, home health and other long-term care, and physician and clinical services – experienced steady growth throughout the period.
Reflecting the growth in spending per person noted in previous charts as well as a rising population, aggregate national spending on personal health care services has risen by 50 percent over the period. Public and private payers are spending more in total, as are patients through their out-of-pocket payments.
Growth in spending covered by public and private insurers has outpaced growth in spending from patient out-of-pocket payments.
The share of total personal health care spending coming from patient out-of-pocket payments has been falling, while public payers are contributing an increasing share. The rise in public payer shares coincides with a steady increase in the number of Medicare beneficiaries and with Medicaid enrollment increases.
Information from a second data source, the Medical Expenditure Panel Survey, confirms the downward trend in the share of total spending covered by patient out-of-pocket payments. The decline over this period is statistically significant at the 95 percent confidence level (as shown by the lack of overlap in the confidence intervals for the point estimates for 2007 and 2014).
Further examination of trends by type of patient shows that the overall decline in patients’ shares of total spending seen in the prior chart was driven by statistically significant declines in the out-of-pocket share among non-elderly patients with private insurance. Out-of-pocket shares for patients with public coverage also fell over the period, with the differences over the full period just failing to meet the 95 percent confidence level for statistical significance.
While the share of health spending covered by patients through out-of-pocket payments has decreased, the rising spending overall has driven out-of-pocket spending amounts to a national average of more than $1,000 per person per year. Per-capita out-of-pocket spending has consistently remained below 3 percent of per-capita disposable income despite this growing magnitude of out-of-pocket payments.

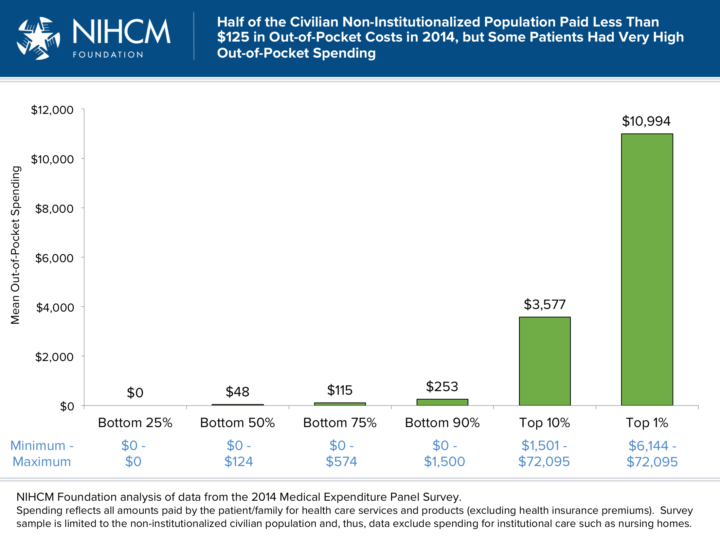
The out-of-pocket spending figures shown in chart 10 are national averages, computed as the aggregate health spending derived from patient cost-sharing payments nationally divided by the total population. As with all averages, these figures mask important differences between individuals. Here we use spending data from individual respondents to the 2014 Medical Expenditure Panel Survey (MEPS) to examine how out-of-pocket costs are distributed across patients. Because the MEPS sample population is restricted to non-institutionalized civilians, spending for institutional settings such as nursing homes – which may have significant patient cost sharing – is not reflected here. This exclusion is one likely reason that the mean out-of-pocket amount computed for the MEPS sample ($585, not shown above) is lower than the national averages shown in chart 10. The MEPS data reveal a very skewed distribution of out-of-pocket spending, with fully half of the survey population having less than $125 in cost sharing expenses in 2014 and 28 percent having no out-of-pocket costs, while some patients had very high out-of-pocket spending. For example, people in the top 1 percent of the distribution had out-of-pocket costs in excess of $6,100, and their mean spending burden was estimated to be nearly $11,000. At the far extreme, one survey respondent reported out-of-pocket costs of more than $72,000 in the year.
The share of total spending that patients pay out of pocket varies dramatically by type of health care service. For example, patients were directly responsible for 29 percent of all spending for care received in nursing homes and continuing care retirement communities in 2006 but only 3 percent of spending for hospital care. These out-of-pocket shares have typically remained stable or declined slightly over the decade. The one exception is for prescription drugs, which show a dramatic decline in the portion of total spending coming from patient out-of-pocket cost sharing. This decline coincides with the advent of Medicare Part D at the start of the observation period.
The share of total spending derived from out-of-pocket payments also varies by patient characteristics. Uninsured patients have the lowest total spending, but pay the largest share of their health spending out of pocket. Patients with Medicaid or other non-Medicare public insurance have the lowest out-of-pocket share.
Out-of-pocket share rises with income. At lower incomes, patients are more likely to have Medicaid.
People in worse health have higher total spending and pay somewhat larger absolute amounts themselves, but their share of total spending paid out of pocket is lower.

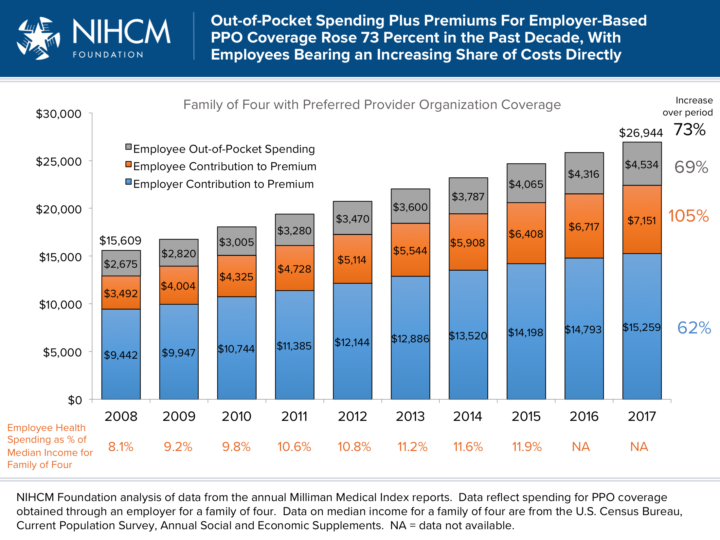
In addition to out-of-pocket costs, consumers who have private insurance or Medicare (and, in some states, Medicaid) also face the cost of health insurance premiums. For the approximately 68 percent of insured patients who are covered by employer sponsored insurance, the worker typically pays a portion of the premium explicitly, and most economists would argue that wages are reduced to offset some or all of the employer-paid contribution to the premium, meaning the worker pays an even greater portion of the total premium in one form or another. Over the past decade, the total premiums for an employer-based preferred provider organization (PPO) policy have increased persistently, and the share employees are being asked to shoulder directly has increased more rapidly than the portion advanced by the employer. Employee direct spending on premiums and out-of-pocket costs had reached 12 percent of the median income for a family of four in 2015 (the most recent year for which income data are currently available).