Infographics
Sources and Burden of Opioid Deaths Update
Published on: May 12, 2020. Updated on: October 20, 2020.
About the Data Insights
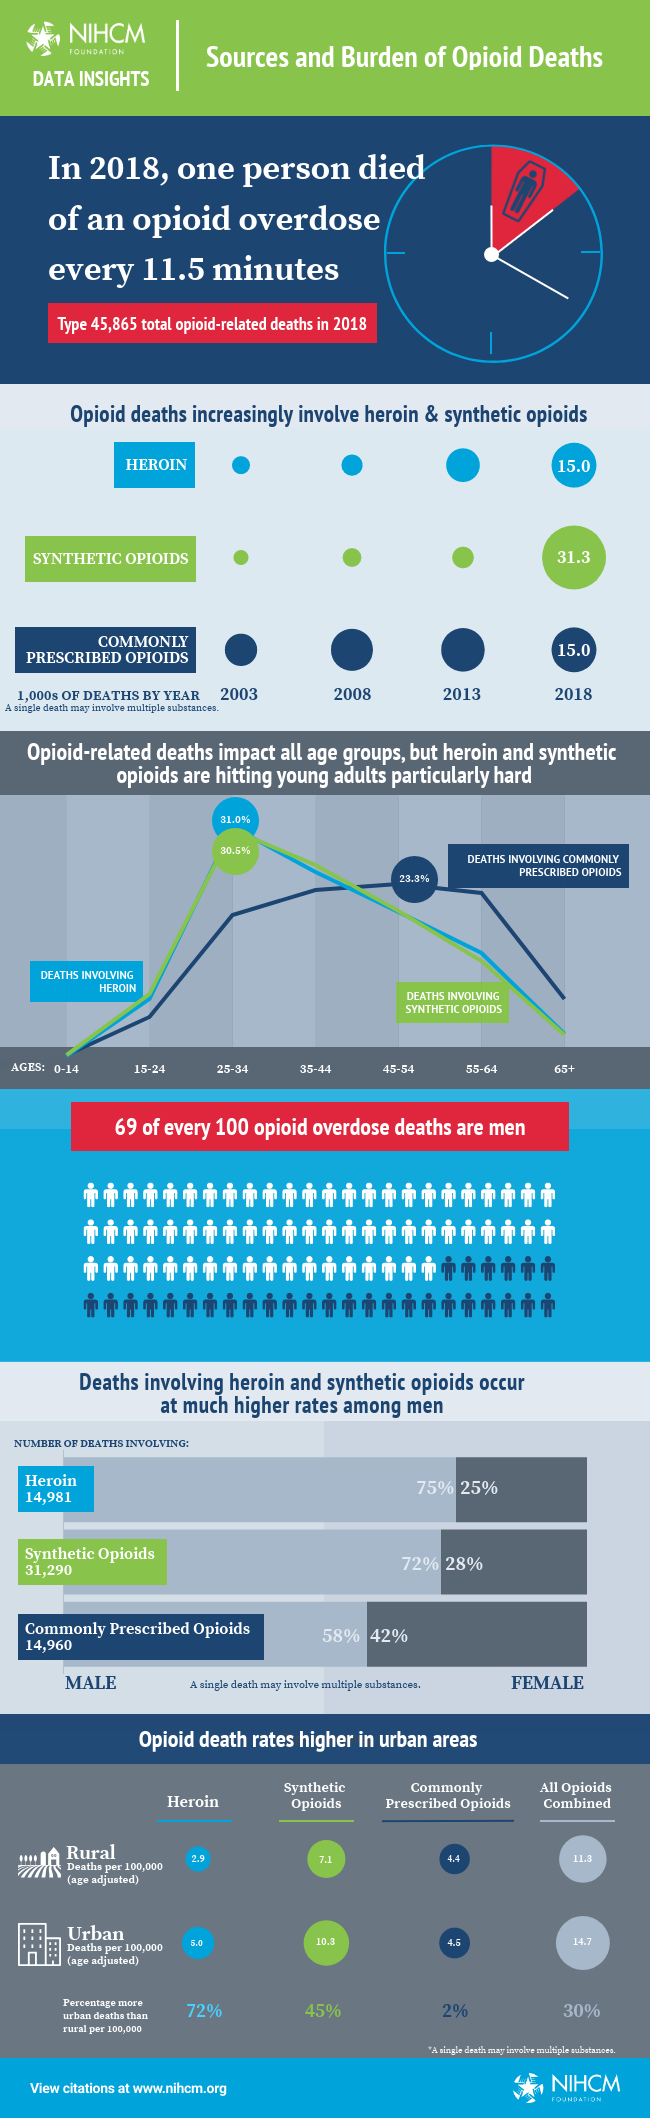
This infographic depicts how the opioid crisis has intensified and evolved despite public and private sector efforts to prevent addiction and increase access to treatment. Overdose deaths from heroin and synthetic opioids like fentanyl increased markedly and hit young adults and men particularly hard. Though some think of the opioid crisis as affecting mainly rural America, per capita death rates from opioids were much higher in urban areas.
Notes on Data and Methods
All data on opioid overdose deaths were derived from the multiple cause of death files of the Wide-ranging Online Data for Epidemiologic Research (WONDER) data system maintained by the Centers for Disease Control and Prevention (CDC). The information was last updated to reflect data through 2018.
Deaths were identified as due to an opioid overdose if the ICD-10 code for the underlying cause of death was X40-X44 (accidental poisoning), X60-X64 (intentional self-poisoning) or Y10-14 (poisoning of undetermined intent) and if any of the multiple cause of death codes indicated that the type of substance involved in the poisoning was T40.1 (heroin), T40.2 (natural and semi-synthetic opioids), T40.3 (methadone) or T40.4 (synthetic opioids other than methadone). Because a single death may involve multiple substances, summing across the number of deaths involving each substance will overestimate the number of opioid-related overdoses.
Following the classification scheme adopted by the CDC, methadone and natural and semi-synthetic opioids (e.g., oxycodone and hydrocodone) were grouped into a single category encompassing commonly prescribed opioids. Synthetic opioids other than methadone include substances such as tramadol and fentanyl (both pharmaceutically manufactured and illicitly manufactured).
In 2018, there were 45,865 overdose deaths involving one or more of the opioids described above, or one death every 11.5 minutes.
Of these deaths in 2018, 14,981 involved heroin, 31,290 involved synthetic opioids other than methadone, and 14,960 involved commonly prescribed opioids (some deaths were classified into more than one category). Comparable figures for the years 2003, 2008 and 2013 were, respectively:
- for heroin – 2,075; 3,031; and 8,235
- for synthetic opioids – 1,399; 2,301; and 3,102
- for commonly prescribed opioids – 7,451; 13,122; and 14,127
In 2018, 4,639 (31.0 percent) of all overdose deaths involving heroin and 9,550 (30.5 percent) of all overdose deaths involving synthetic opioids occurred among individuals aged from 25 to 34, whereas 3,490 (23.3 percent) of all overdose deaths involving commonly prescribed opioids occurred for individuals aged 45 to 54.
In 2018, 31,498 (68.7 percent) of the 45,865 opioid-related deaths occurred among men.
Compared to the 51-to-49 percent male-female split for deaths from all causes, men were significantly more likely than women to die from opioids, regardless of the substance involved. The starkest differences, however, were seen for deaths involving heroin and/or synthetic opioids. Of the 14,981 deaths involving heroin, 11,279 (75.3 percent) occurred among men. Similarly, of the 31,290 deaths involving synthetic opioids, 22,501 (71.9 percent) occurred among men. For commonly prescribed opioids, males accounted for 8,713 of the 14,960 deaths (58.2 percent).
The urban/rural breakdown of opioid deaths relied on the National Center for Health Statistics’ 2013 system for classifying counties as urban or rural according to whether the county was in a metropolitan statistical area (MSA) or not. Deaths were assigned to location based on the county of the person’s legal residence.
In 2018, there were 41,148 opioid overdose deaths among residents of urban areas, or 14.7 deaths per 100,000 people (using age-adjusted population figures). Comparable figures in rural areas were 4,717 overdose deaths for a rate of 11.3 deaths per 100,000. Thus, after adjusting for the population’s age distribution, the average urban resident was 30 percent more likely than the average rural resident to perish from an opioid overdose.
Comparable figures by type of opioid were:
- Heroin – 13,818 urban deaths and 1,163 rural deaths, translating to death rates of 5.0 deaths per 100,000 urban residents and 2.9 deaths per 100,000 rural residents, or a 72 percent higher likelihood of dying from a heroin-involved overdose among urban residents.
- Synthetic Opioids – 28,449 urban deaths (10.3 per 100,000 urban residents) vs. 2,841 rural deaths (7.1 per 100,000 rural residents) for a 45 percent higher rate in urban areas.
- Commonly Prescribed Opioids – 12,991 urban deaths (4.5 per 100,000 urban residents) vs. 1,969 rural deaths (4.4 per 100,000 rural residents), or a 2 percent higher rate in urban counties.
Related Resources

Webinar
May 18, 2020. Updated on: March 02, 2021.
Growing Challenges of Substance Use, Treatment & Recovery During COVID-19
More Related Content
See More on: Social Determinants of Health | Substance Use